|
During 1993 we have added two
satellite images of the Corinthia to our data set; a panchromatic
scene from SPOT (Fig. 1), the French satellite agency, and a
multi-spectral scene from LANDSAT (Fig. 2), the US satellite
company. The image from SPOT is a single spectral band scene,
gray scale, acquired in May 1991 at the resolution of ten meters
(per pixel) and covers an area of 60 X 60 kilometers. The LANDSAT
scene, on the other hand, is an EOSAT archive image acquired
in June 1987 with a resolution of 28.5 meters. It covers a larger
area of 185 X 170 kilometers and is a Thematic Mapper (TM) scene
with seven colored spectral bands that can be displayed individually
or in combination with others. The different nature of the two
satellite images has dictated very different uses for them.
One can see roads and agricultural field boundaries clearly
on the SPOT image and, therefore, we are using it to analyze
the patterns in the landscape along the southern coast of the
Corinthian Gulf between Corinth and Sikyon. We have been able
to identify uniform grid systems conforming to the practice
of Roman centuriation. This particular study has been carried
out using AutoCAD and CAD Overlay by measuring road and field
spacing on the image and testing against various hypothetical
grids of Roman land division.
The grid systems are created in
AutoCAD and can be superimposed on the satellite image using
CAD Overlay. The preliminary success of this investigation has
lead us to purchase an additional SPOT image, a 15 minute by
15 minute window to the east of Corinth so that we may in the
future study the land organization to Corinth's second port
of Cenchreai on the Saronic Gulf. The LANDSAT image is of coarser
resolution (28 meters per pixel vs. 10 meters) and, therefore,
is better suited to studying land use pattern, ground cover
and geological interpretation. In the future we may consider
these well known applications of the LANDSAT multi-spectral
scene in this study.
The SPOT satellite image came
in the BIL (band interleaved by line) format, which was imported
into the various kinds of software that we use, e.g., IDRISI.
The original SPOT image was shipped to us on a series of twenty-two
3.5" diskettes which proved to be somewhat of a challenge to
download and decompress. The more recent 15 minute window from
SPOT was shipped on a compact disk, which greatly facilitated
its use. The total size of the larger SPOT image is approximately
50 MB while the total size of the LANDSAT image is approximately
360 MB. These large files are stored on an auxiliary optical
disk (Panasonic Optical Disk Drive LF-7010) and parts of the
scenes have been clipped for processing and analysis as necessary.
The LANDSAT scene came on mainframe 'computer compatible tapes'
(CCT), which necessitated the use of university facilities to
download the files onto our PC's. This was accomplished by utilizing
a 250 MB tape backup system (Colorado Jumbo Trakker).
|
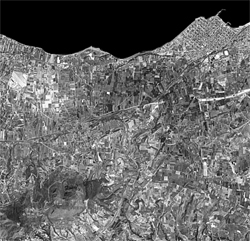
Figure 1
Licensed by SPOT
Image Corporation,
Reston, Virginia
Click on the
plans to enlarge.
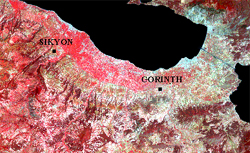
Figure 2
Landsat thematic
mapper image depicting the blue, green, and near-infrared bands
with a color-composite palette
|

;)
;)